

Ad platforms give you data, but they rarely give you clarity. You might see the ROAS, click-through rates, and conversions, but what do they really mean? And what should you act on?
That’s why I’ve been trying out AI ads reporting tools that can actually make sense of it all.
These tools take care of the manual, repetitive work—pulling reports from multiple ad platforms, highlighting what’s working, and giving you a clear view of your performance without the clutter.
Some of them go even deeper, showing you how specific creatives perform, breaking down ROAS by audience, and helping you compare results across campaigns.
If you’re managing ads regularly, these tools can save you hours. Here are the 10 I think are worth your time in 2025.
Factors to Consider When Choosing AI Ads Reporting Tools
Choosing the right AI ads reporting tool isn’t about picking the most expensive or the most popular option. I look at how well the tool fits my workflows, what insights it offers, and whether it gives me more clarity, not more complexity. Below are the key factors I always consider before selecting any tool.
#1: Platform & Channel Coverage
The first thing I check is which ad platforms the tool supports. This includes Meta (Facebook and Instagram), Google, TikTok, LinkedIn, and sometimes Pinterest or Snap.
If I run ads on more than one channel, I want a tool that consolidates them all in one place. This will help me compare performance, spot patterns, and make faster decisions without jumping between dashboards.
Moreover, some tools only focus on Meta and Google while others also pull in data from Amazon, Bing, and Shopify. I go with the one that matches where I spend the most.
#2: Attribution Capabilities
Attribution tells me which ad or channel led to a result, like a sale or sign-up. It sounds simple, but in practice, it’s where a lot of reporting tools fall short. Good tools let me choose from different models: first-click, last-click, or multi-touch. This gives me the flexibility to measure performance from different angles.
I also check if the tool supports post-iOS14 attribution. Since Apple made tracking harder, I need tools that work around it using server-side tracking or UTM-based methods (UTMs are simple tags added to URLs to track where traffic is coming from).
#3: Insights & Reporting Quality
Numbers alone don’t help if I can’t understand what to do with them. That’s why I look for tools that offer meaningful insights, such as:
- Creative performance breakdowns
- Top converting campaigns
- Alerts for poor ROAS (Return on Ad Spend)
If the tool can point these out clearly, it saves me time and prevents mistakes. Some tools even generate plain-language summaries, which are useful when I need to share updates with a client or a non-technical teammate.
#4: Ease Of Use & Setup Time
I don’t want to spend weeks figuring out how to use a tool. The best tools offer:
- Guided setup.
- Pre-built dashboards.
- Easy integrations with Shopify, Google Analytics, or Meta Business Manager.
Additionally, I check if the tool lets me set up custom metrics or rename columns. That flexibility matters. If I need to depend on a data analyst just to generate reports, the tool is not worth it for my use.
#5: Pricing & Scalability
I always consider the starting cost, how pricing changes as I grow, and whether there’s a free plan or trial. However, the pricing of these tools vary significantly: some tools charge based on ad spend whereas others use flat monthly fees or user limits. So, I prefer tools with transparent pricing and no hidden fees.
Also, since I work with various clients or manage multiple brands, I prefer tools that allow multiple workspaces or client folders. This saves me the hassle of switching accounts or mixing data.
What Are the Best AI Ads Reporting Tools in 2025?
Here is an in-depth summary of the 10 best AI ad reporting tools and their best features:
1. Team-GPT
Team-GPT offers the best place to create advertising reports with its collaborative AI workspace that lets your team build, refine, and share ad performance reports using powerful prompts and real-time AI collaboration.
Unlike typical dashboards, Team-GPT works like an AI co-pilot where you generate your own ad reports by feeding in campaign-level data.
With shared workspaces, real-time editing, and prompt templates built for ad reporting, Team-GPT is ideal for teams that want more flexibility and context when analyzing campaign performance.

Full Disclosure – Even though Team-GPT is our platform, I’ll provide an unbiased perspective on why it is the best AI ads reporting tools in 2025.
How It Works
Here’s my exact workflow for creating ad reports using Team-GPT:
Step 1: Build a Reporting Prompt That Fits My Campaign
Instead of using a rigid template, I use Team-GPT’s Prompt Builder to create my own reporting prompt. I start by describing my task:
“I want a weekly performance summary for our Meta + Google Ads campaigns.”

The builder then asks me smart questions which I answer as per my requirements:
One thing I always do is, once the platform creates a prompt specific to my needs, I click on “Save and Use” so that the next time I need to create a report, I won’t have to do it from scratch.

Here’s a step-by-step demo on how to build a prompt that will help you create comprehensive reports for your ads: How to use the Prompt Builder | Team-GPT.
Step 2: Feed in Raw Data and Pick the Right AI Model
After building the prompt, I upload the raw campaign data, choose the model based on my output needs. For instance I’ll go with:
- GPT-4o, if I want it well-written and polished.
- Claude, if it’s data-heavy and needs interpretation.
- Gemini, if I want multiple creative angles or language tweaks.
This flexibility helps me get the tone and insights right without rewriting everything. For this, I’ll go with Claude.

Step 3: I Generate the Report and Tweak on the Spot
Team-GPT gives me a full performance breakdown in under a minute. Here’s what I love:
- It gives me a brief overview of both campaigns spend, ROAS, and CPA to start with.
- It then starts breaking down both the channels granularly and ends by adding an analysis and recommendation for the next steps.
Moreover, I can:
- Edit sections directly,
- Regenerate only the conclusion or CTA if I want.
- Add a note like: “Make the analysis & recommendation part more comprehensive”.

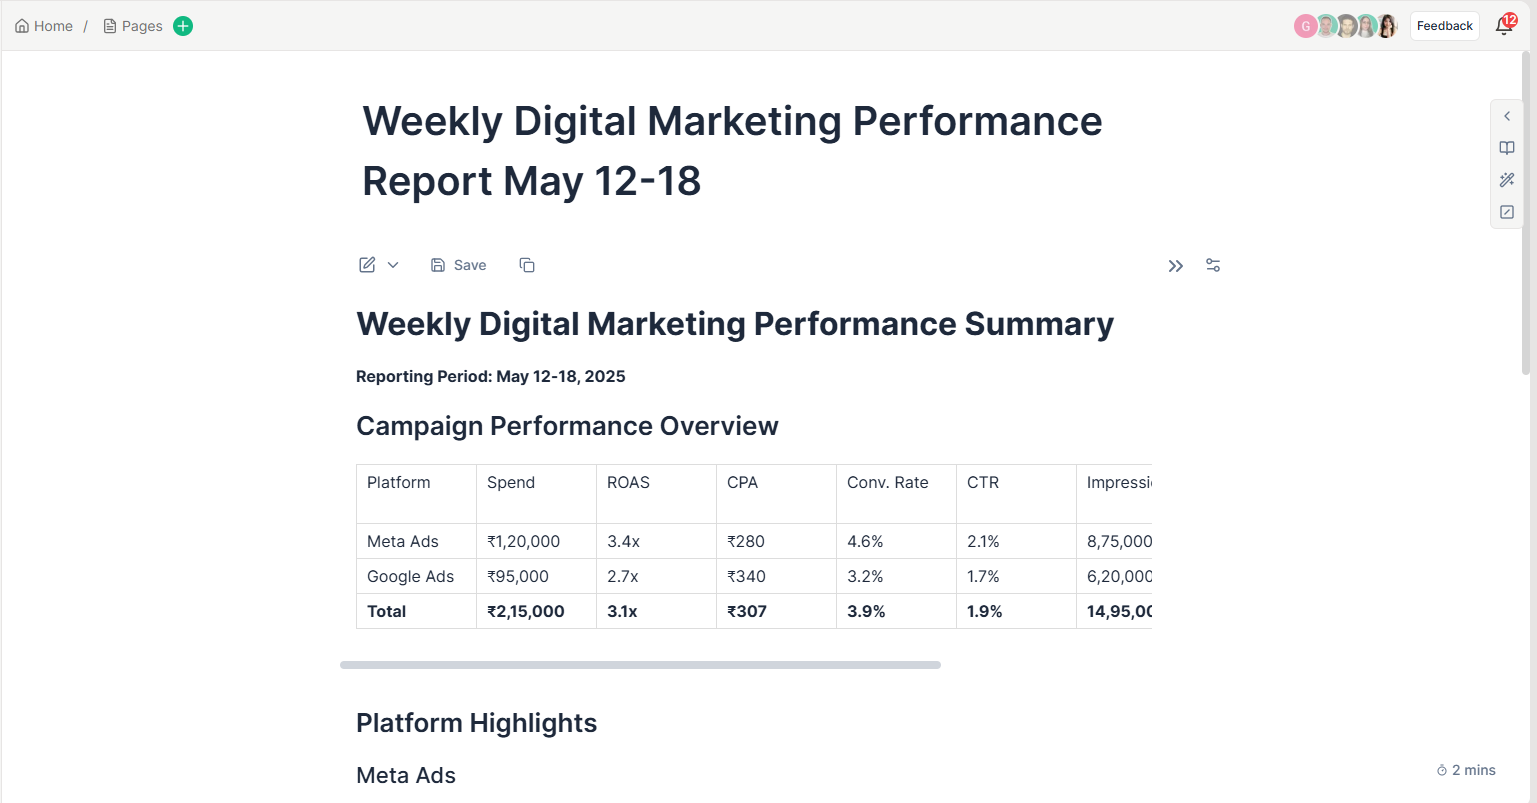
Step 4: Turn It Into a Page and Share It
Once I’m happy with the content, I hit “Turn into Page”. This opens up a clean doc-style interface, like Google Docs, but built into Team-GPT. From there, I:
- Add comments for my team (e.g. “Pull in creative screenshot here”)
- Drop it into a client folder
- Share the link or export as PDF
Here’s how it looks after turning into a page:
(Optional) Step 5: I Add My Own Reporting Style as Custom Instructions
This is where things get fun. I can save my own writing preferences as Custom Instructions. For example:
- “Explain metrics in plain English, not jargon.”
- “Highlight not just what performed, but why.”
- “End with 2 action items for the next sprint.”
Once set, every future report follows this format and there’s no need to rebrief the AI every time.
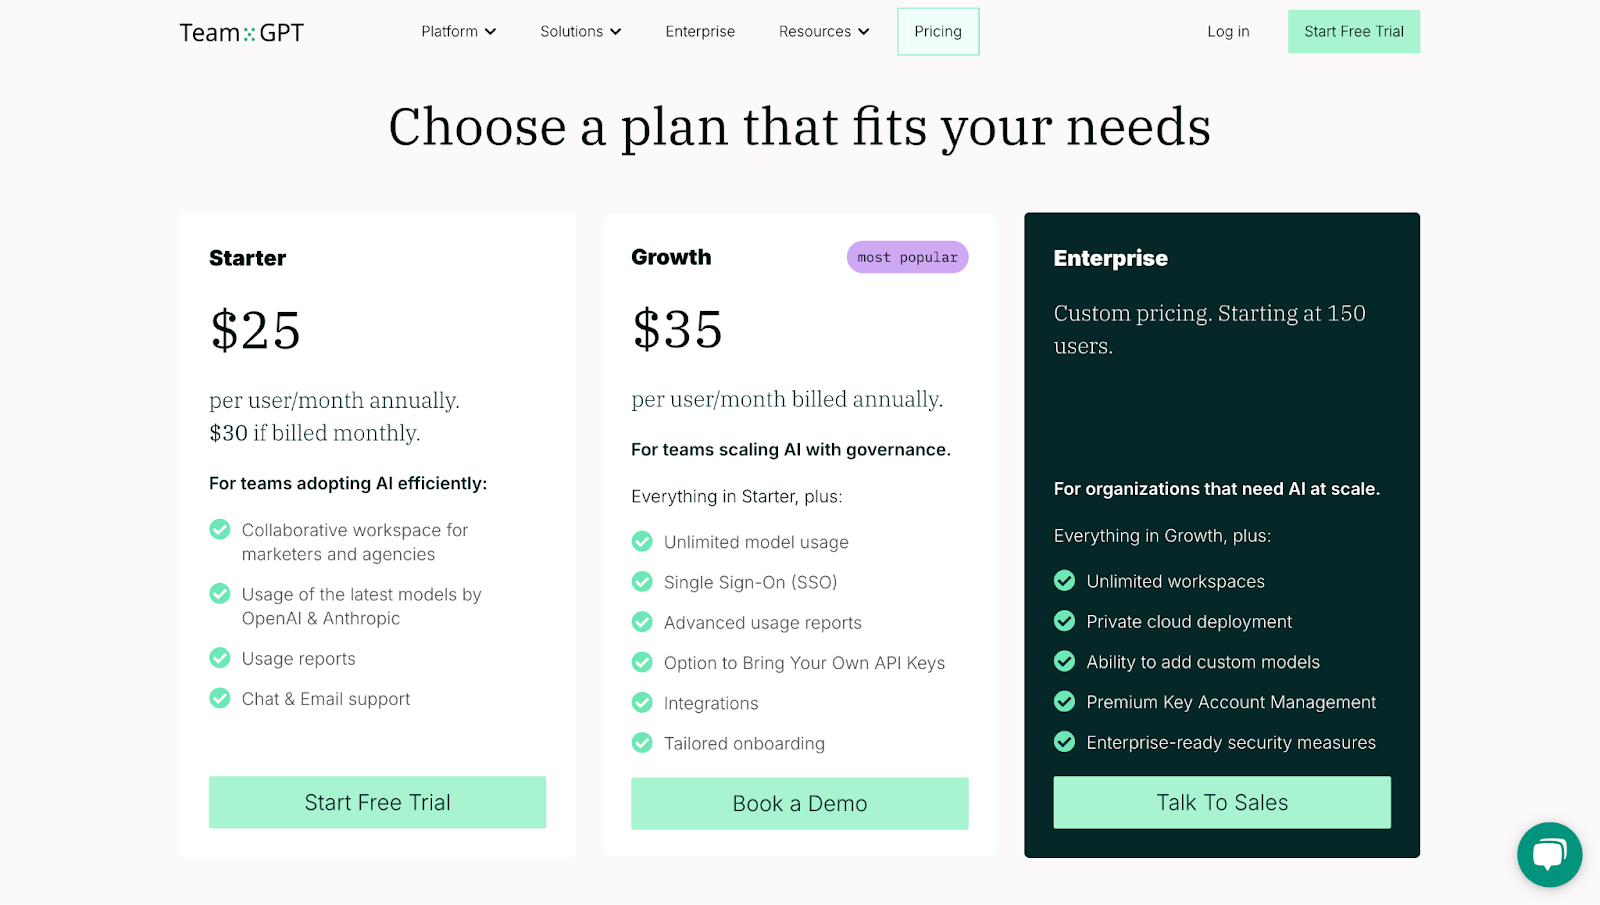
Team-GPT Pricing
Team-GPT offers three pricing plans, depending on your team size and needs:
- Business Plan – $25/user/month (billed annually). This plan includes shared workspaces, image generation, and team usage tracking—ideal for small marketing teams.
- Growth Plan – $35/user/month (billed annually). Great for growing teams using multiple AI models. You get unlimited access to all supported models and support for your own API keys.
- Enterprise Plan – Custom pricing. Built for organizations with 150+ users. It includes premium support, advanced controls, and custom model integrations.
Team-GPT Pros and Cons
✅ Prompt-based reports that give you full control over how your campaigns are presented.
✅ Works with all major AI models—GPT-4o, Claude, Gemini—so you’re not locked into one.
✅ Share, organize, and edit reporting workflows with your team in real time.
✅ Ideal for agencies and teams that want flexible report formats and prompt libraries.
❌ Some features like image generation require your own API key.
❌ Advanced options (like custom model integrations) are only available in higher tiers.
2. Google Analytics
Best For: Businesses of all sizes looking for ad performance and web analytics in one place.
Similar To: Adobe Analytics, Mixpanel, Matomo.
Google Analytics is one of the most reliable ad reporting tools I’ve used. It pulls together traffic, conversions, and campaign performance in a single dashboard. If you’re running ads on Google, YouTube, or even across your website and apps, GA helps you track how people arrive, interact, and convert.
The latest version—GA4—is based on event tracking, not session tracking. That means it can follow user behavior across platforms and devices much more accurately. I’ve found this especially helpful when trying to track mobile users or retarget across channels.
Google Analytics Features
- Event-Based Tracking — GA4 tracks every action (clicks, views, form submissions) as separate events, which gives more accurate data than traditional session-based tools.
- Cross-Platform Reporting — You can track how users move between mobile apps and websites, giving a more complete view of the customer journey.
- Conversion Reports — You can see which campaigns, pages, or user actions lead to actual business results like purchases, sign-ups, or downloads.
Standout Feature
Predictive metrics have been incredibly useful for me. GA4 can predict which users are more likely to convert or drop off based on past behavior. I use this to create custom audiences for Google Ads and invest budget where it actually counts.
These insights are built right into the dashboard; no extra setup needed. It’s helped me make decisions that feel less like guesswork and more like strategy.

Google Analytics Pricing
Google Analytics offers two plans:
- Free Plan — $0/month. Includes standard tracking, event reports, and integrations with Google Ads.
- Analytics 360 — Starts at around $50,000/year. Includes faster data processing, sub-properties, roll-up reporting, and advanced support.
Google Analytics Pros and Cons
✅ Event-based tracking gives cleaner and more flexible reporting.
✅ Predictive insights help you invest your ad spend where it matters.
✅ Seamless integration with other Google tools like Ads and BigQuery.
❌ The interface can feel overwhelming without proper training.
❌ Historical data import is limited if you’re switching from older GA versions.
3. TapClicks
Best For: Enterprise customers seeking to manage and report on large volumes of advertising data.
Similar To: Adverity, Improvado, Datorama.
TapClicks is a reporting platform that brings all your marketing and ad data into one dashboard. I like using it because it handles everything from campaign performance to SEO and PPC (Pay-Per-Click) analytics in one place.
The platform is especially helpful if you’re running campaigns across multiple channels and need to consolidate reports for clients or internal teams.
TapClicks Features
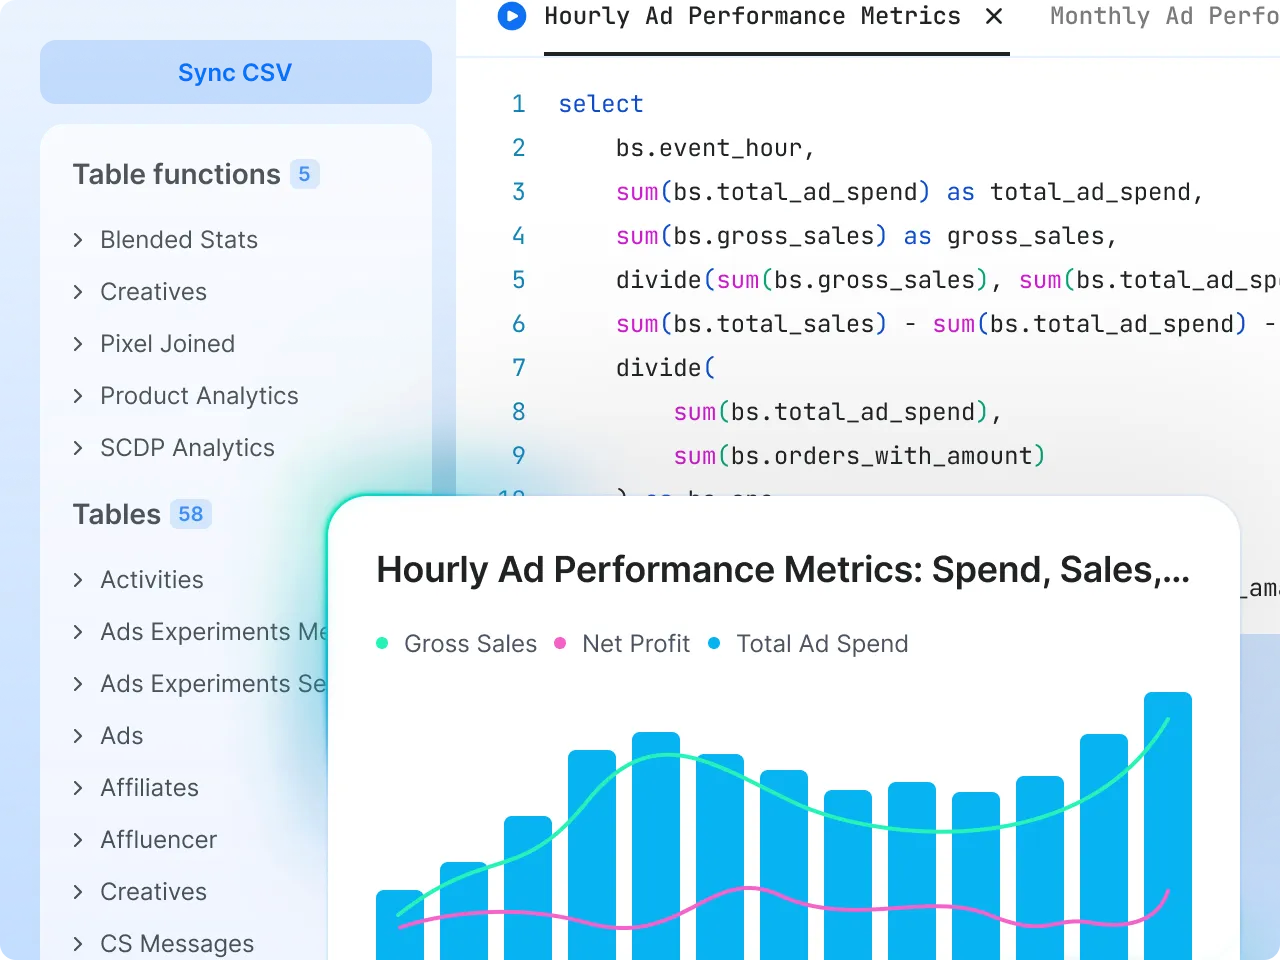
- Report Studio — You can create custom, drag-and-drop reports using widgets, templates, and visual elements. This helps me build reports that look clean and are easy to share with clients.
- Quick Reports — You can generate instant reports in multiple formats and send them to your team or clients with just a few clicks.
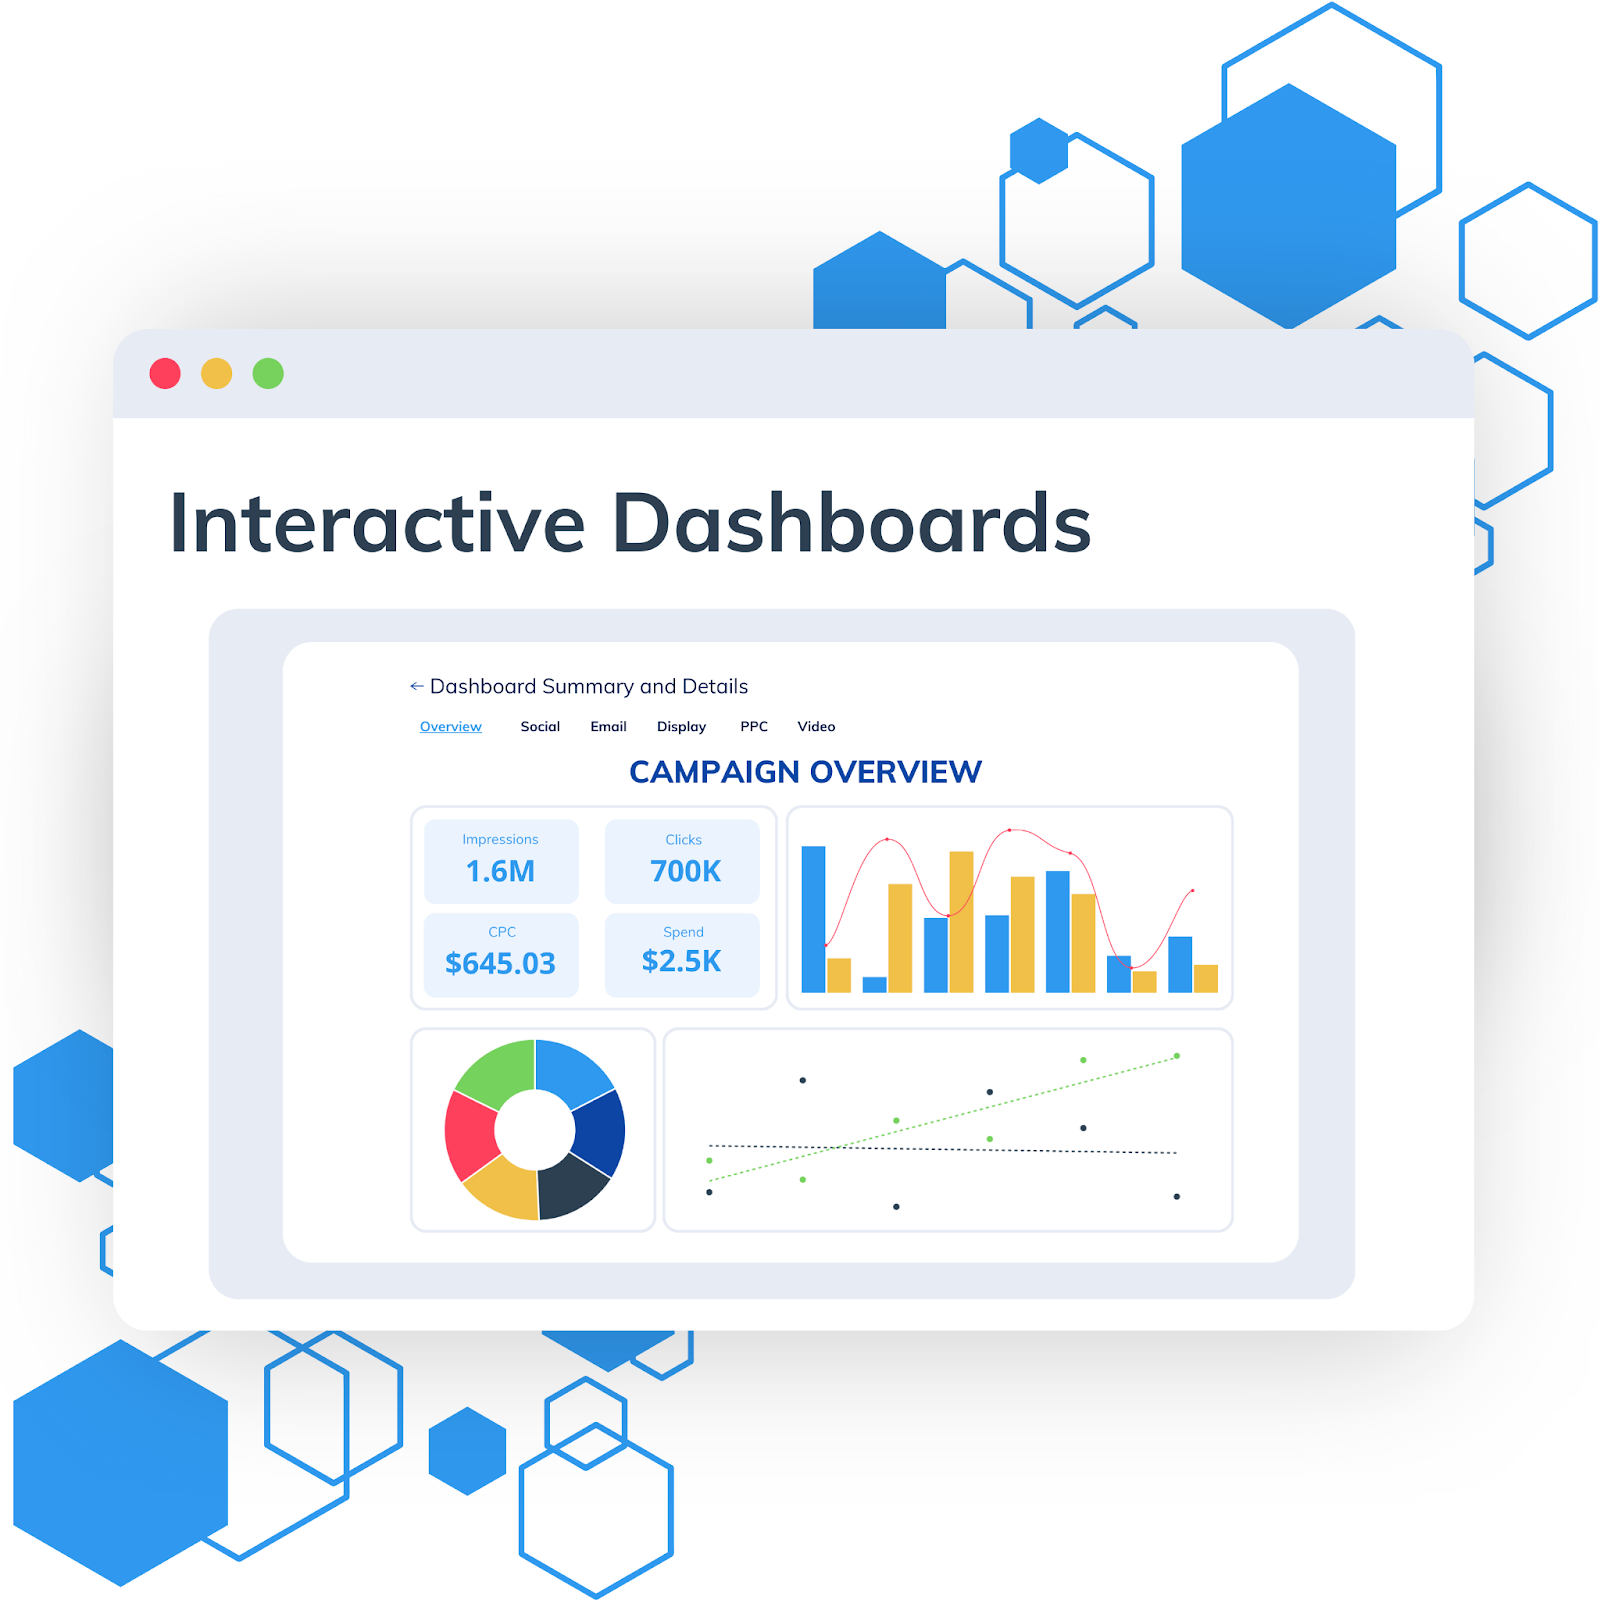
- Interactive Dashboards — I use these to track campaign performance across channels in real time. You can view updated metrics automatically without refreshing or importing files.
Standout Feature
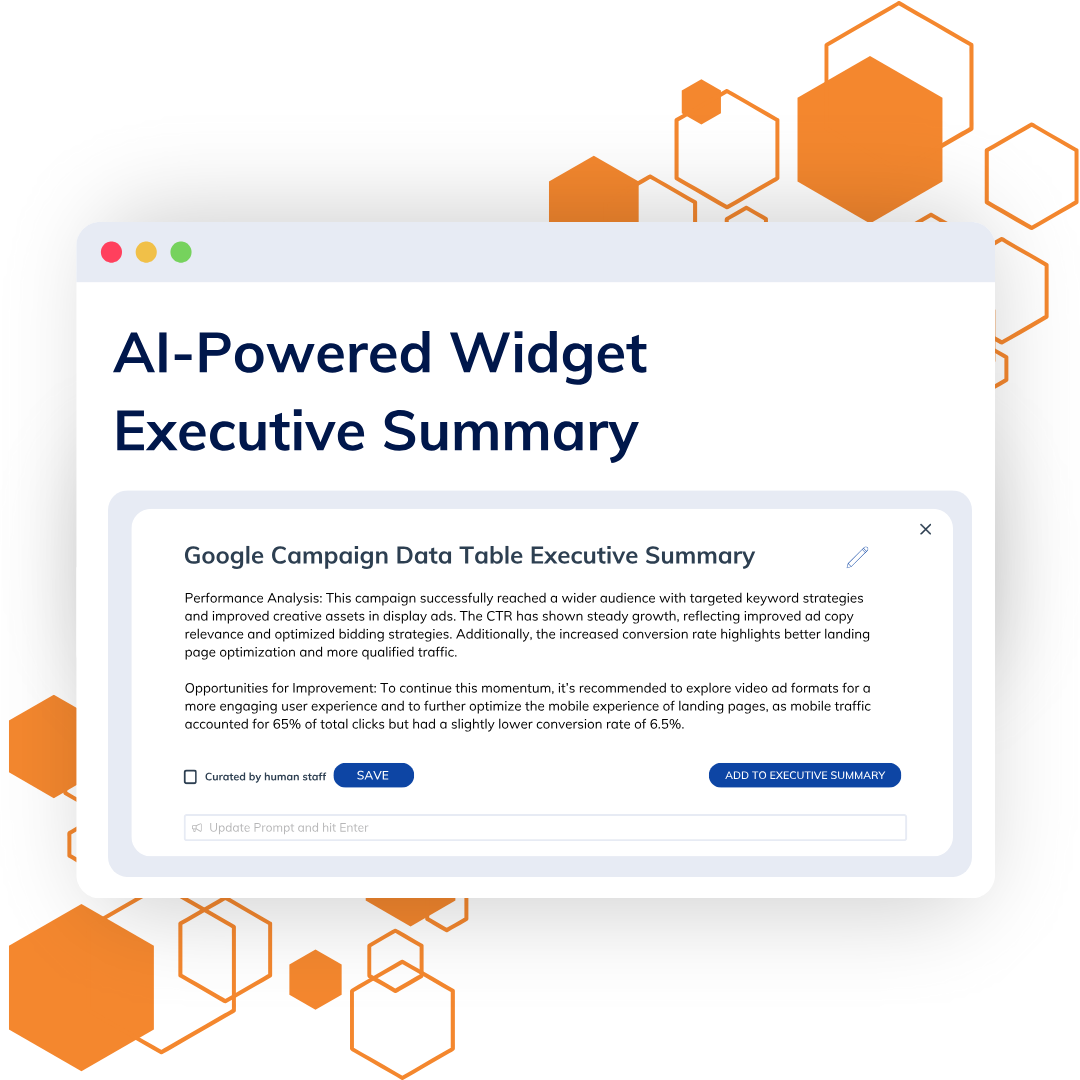
TapInsights with AI-powered summaries is what makes TapClicks valuable for me. Using built-in AI, the platform highlights what’s working, where performance is dropping, and what to focus on next.
I’ve used this to guide campaign reviews with clients and quickly get alignment on what needs attention. It’s especially useful when you have to manage multiple reports and can’t manually go through each one.
TapClicks Pricing
TapClicks offers three pricing plans:
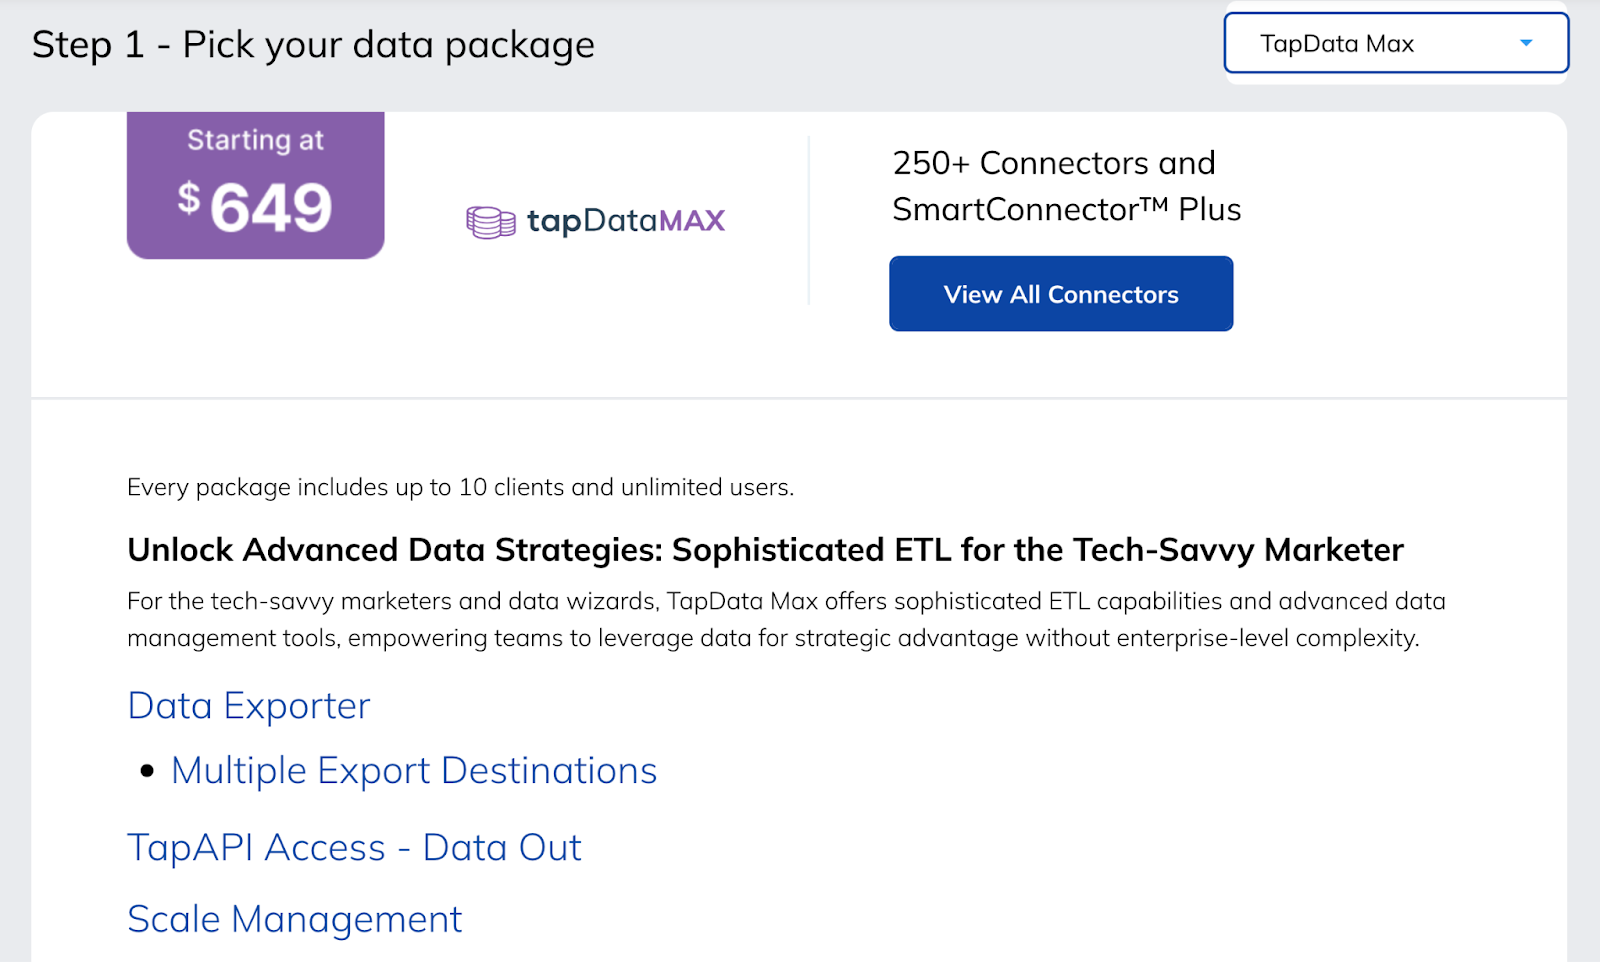
- TapData Lite — Starts at $99/month. Includes up to 10 clients, unlimited users, and 64 connectors. Basic upload options like Google Sheets, email, manual upload, and TapAccess.

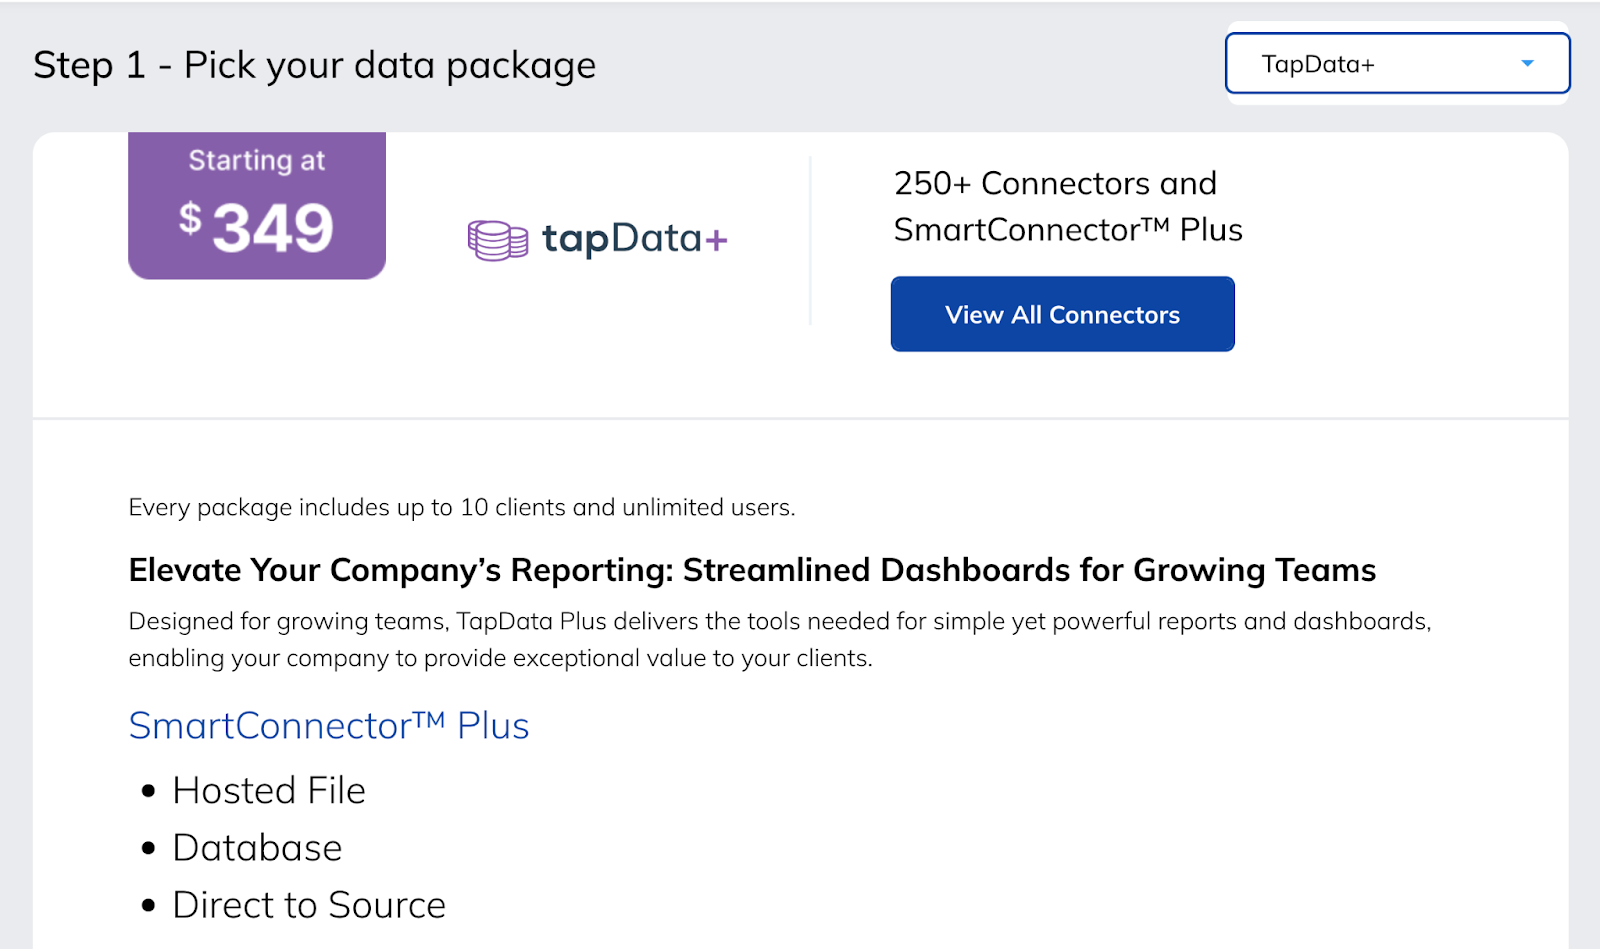
- TapData Plus — Starts at $349/month. Includes 250+ connectors and SmartConnector Plus. Supports hosted file uploads, databases, and direct data sourcing.
- TapData Max — Starts at $649/month. Adds advanced features like ETL tools (Extract, Transform, Load), API access, scale management, auto assignment, and multiple export destinations.
TapClicks Pros and Cons
✅ Centralized view of all ad performance across platforms.
✅ Automated reports and AI summaries save time.
✅ Competitor tracking with iSpionage gives added strategic insights.
❌ Takes time to learn, especially for new users.
❌ Real-time data updates may lag occasionally.
4. Triple Whale
Best For: DTC (direct-to-consumer) eCommerce brands looking for full-funnel ad reporting and creative analytics.
Similar To: Northbeam, Polar Analytics, Lifesight.

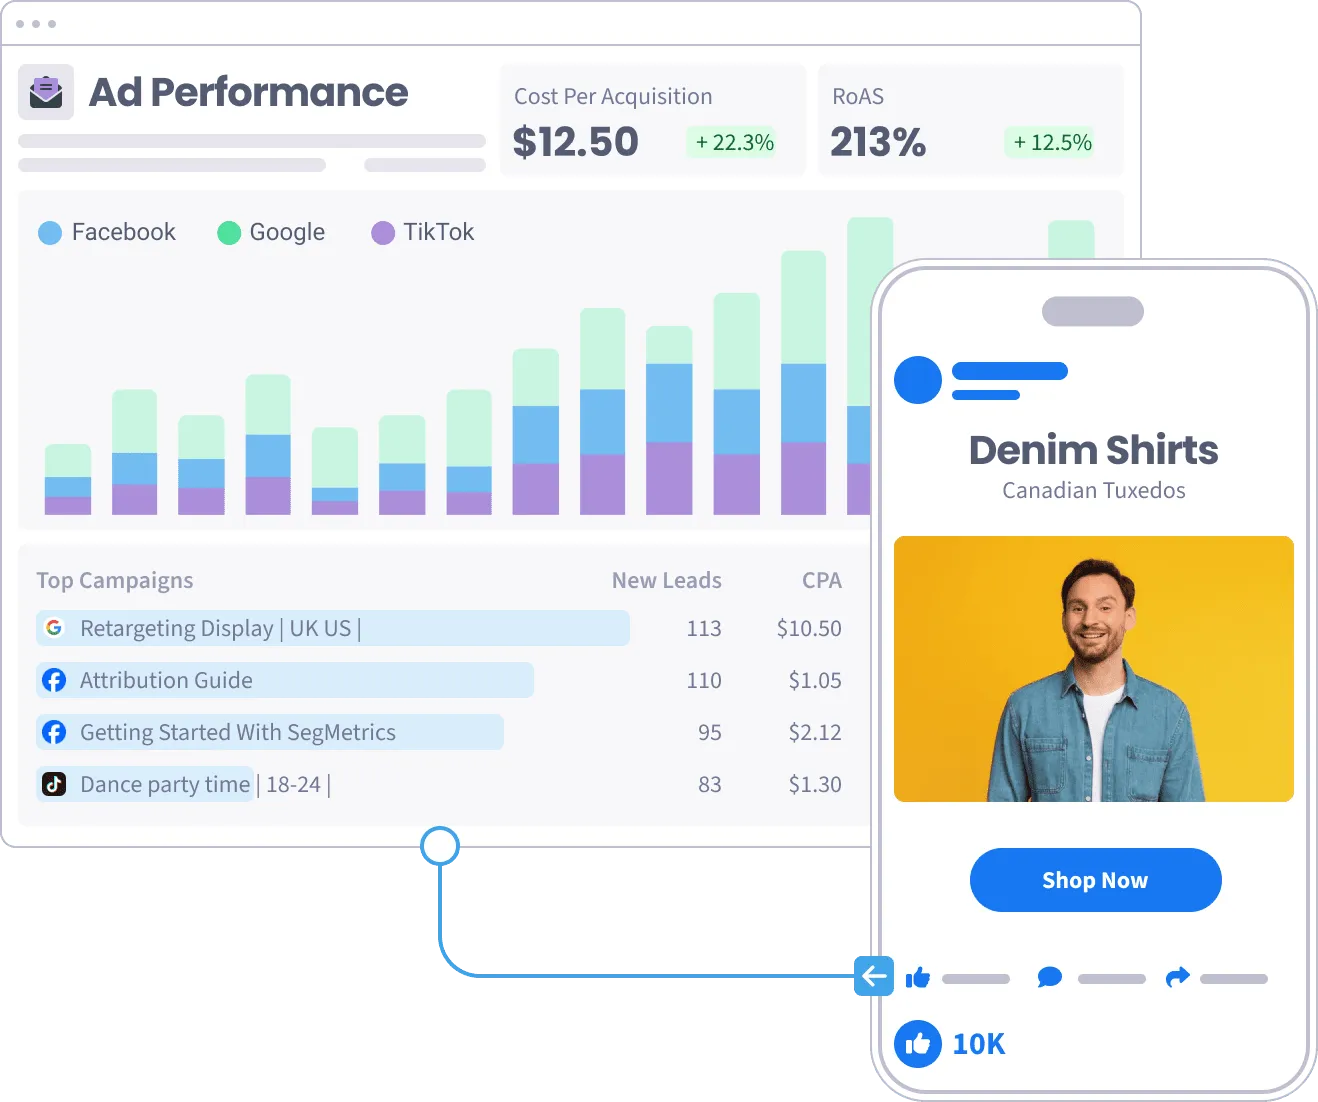
Triple Whale is a reporting platform I use when I need one place to track all ad performance across Meta, Google, TikTok, Amazon, and more. The tool pulls your revenue, spend, customer journey, and creative data into one clean dashboard.
What stands out to me is how easy it is to go from high-level reporting to individual ad and product insights without juggling multiple tools.
Triple Whale Features
- Attribution Tracking — Use Triple Pixel to track multi-touch attribution (meaning it shows which ads or channels contributed to a sale). You can switch between first-click, last-click, or blended attribution views.
- Instant Analytics — You can see results at a glance with creative, cohort, and product-level performance. This helps me figure out which products drive the highest ROAS, and which ads are underperforming.
- Post-Purchase Surveys — Capture customer feedback directly after checkout. This helps validate attribution and understand how customers found your brand.
Standout Feature
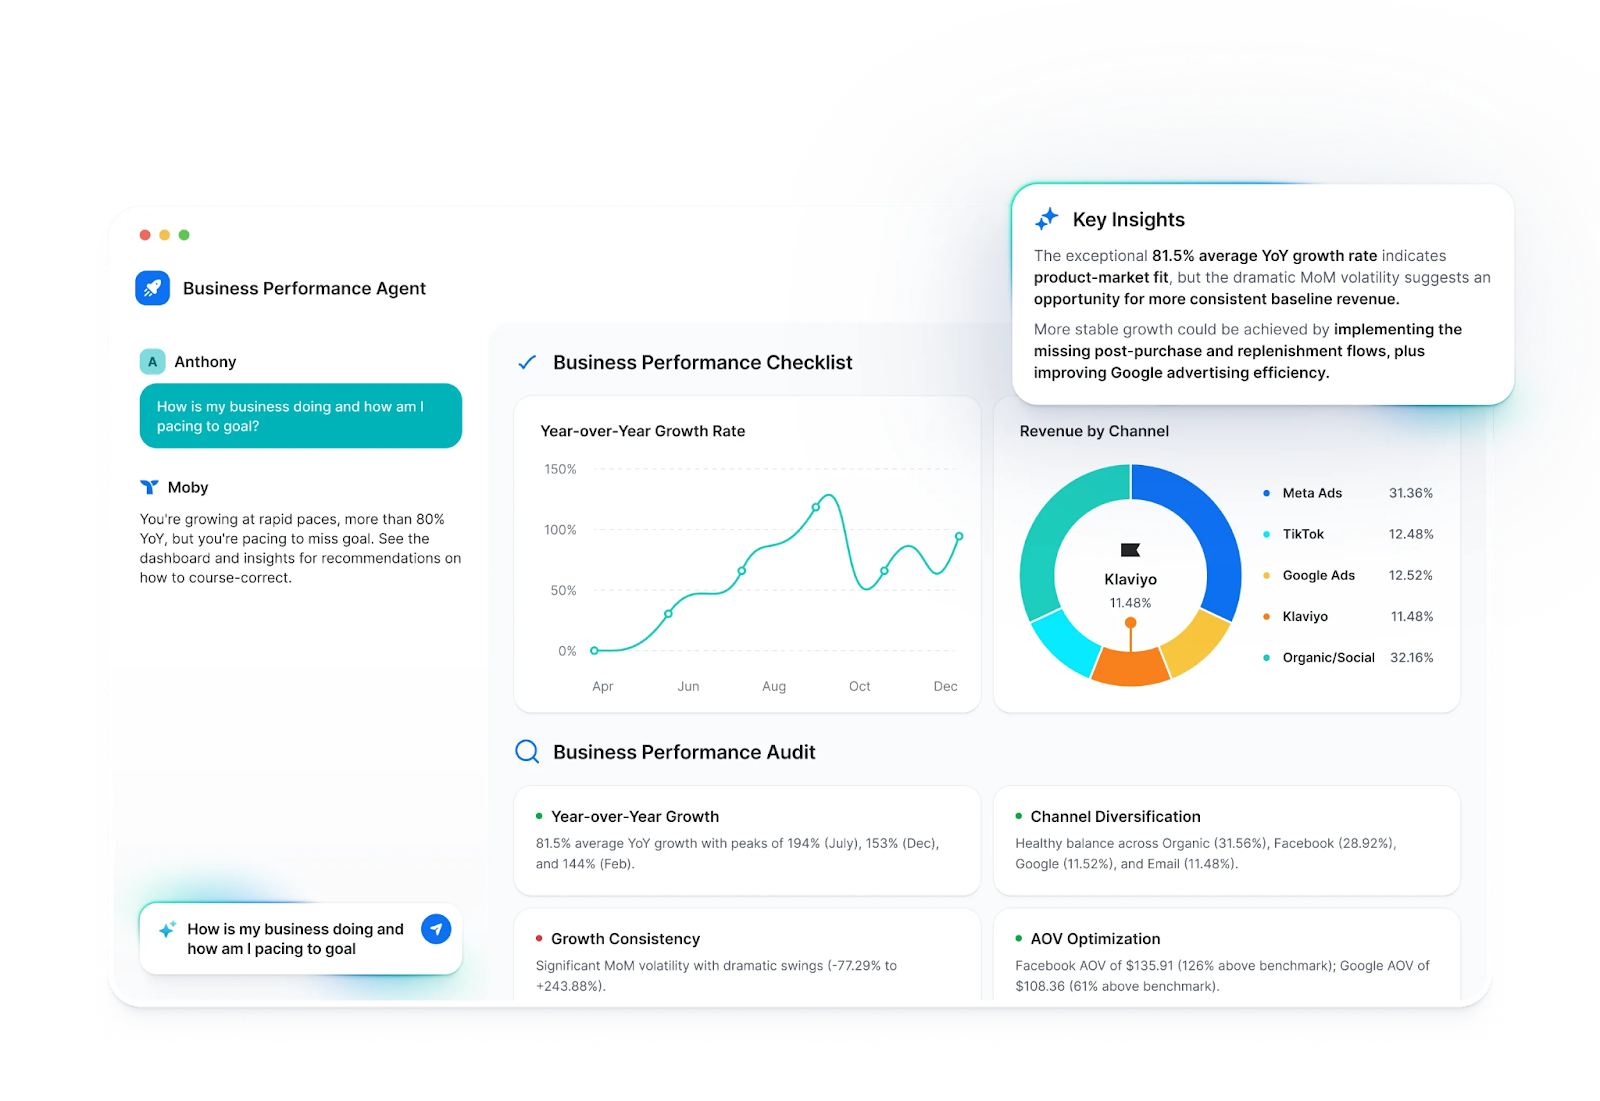
Moby AI and Creative Analytics are the two features I use the most. Moby AI gives real-time summaries of what’s working, what’s not, and what actions to take. It flags anomalies before I notice them.
Creative Analytics, on the other hand, breaks down which images, videos, or copy lines are driving results, not just clicks. I’ve saved a lot of money by stopping underperforming ads early based on this data.
Triple Whale Pricing
- Free Plan — $0/month. Includes key metrics tracking across ads, email, SMS, Amazon, and more. First- and last-click attribution. 12-month data look back for up to 10 users.
- Starter Plan — $149/month. Adds multi-touch attribution with Triple Pixel, integrations with ad platforms, influencer analytics, and detailed summary reports.
- Advanced Plan — $219/month. Includes subscription analytics, creative performance, cohort breakdowns, and a no-code dashboard builder.
- Professional Plan — $449/month. Adds marketing mix modeling (MMM), predictive budget tools, SQL access, and deeper segmentation.

Triple Whale Pros And Cons
✅ Real-time performance tracking across all major ad platforms.
✅ Clean, visual dashboards with creative and product-level insights.
✅ Moby AI and Moby Chat help speed up reporting and analysis.
❌ Limited to eCommerce use cases; less relevant for B2B.
❌ Free version is very basic compared to paid tiers.
5. Northbeam
Best For: eCommerce brands with high traffic looking for precise attribution, media mix modeling, and creative analytics.
Similar To: Triple Whale, Rockerbox, Measured.

Northbeam is my go-to platform when I need clarity on what’s driving conversions across channels. It stands out for its accuracy, especially when attribution gets tricky. It connects first-party data with real-time ad performance, giving you a full view of how people actually interact with your brand—from first impression to final sale.
Northbeam Features
- Multi-Touch Attribution (MTA) — Track how each touchpoint contributes to a conversion using customizable attribution models. You can set flexible lookback windows and track both clicks and impressions.
- Media Mix Modeling (MMM+) — Use machine learning to predict how changes in ad budget will impact revenue. I’ve used this to allocate spend more efficiently across Meta, Google, TikTok, and email.
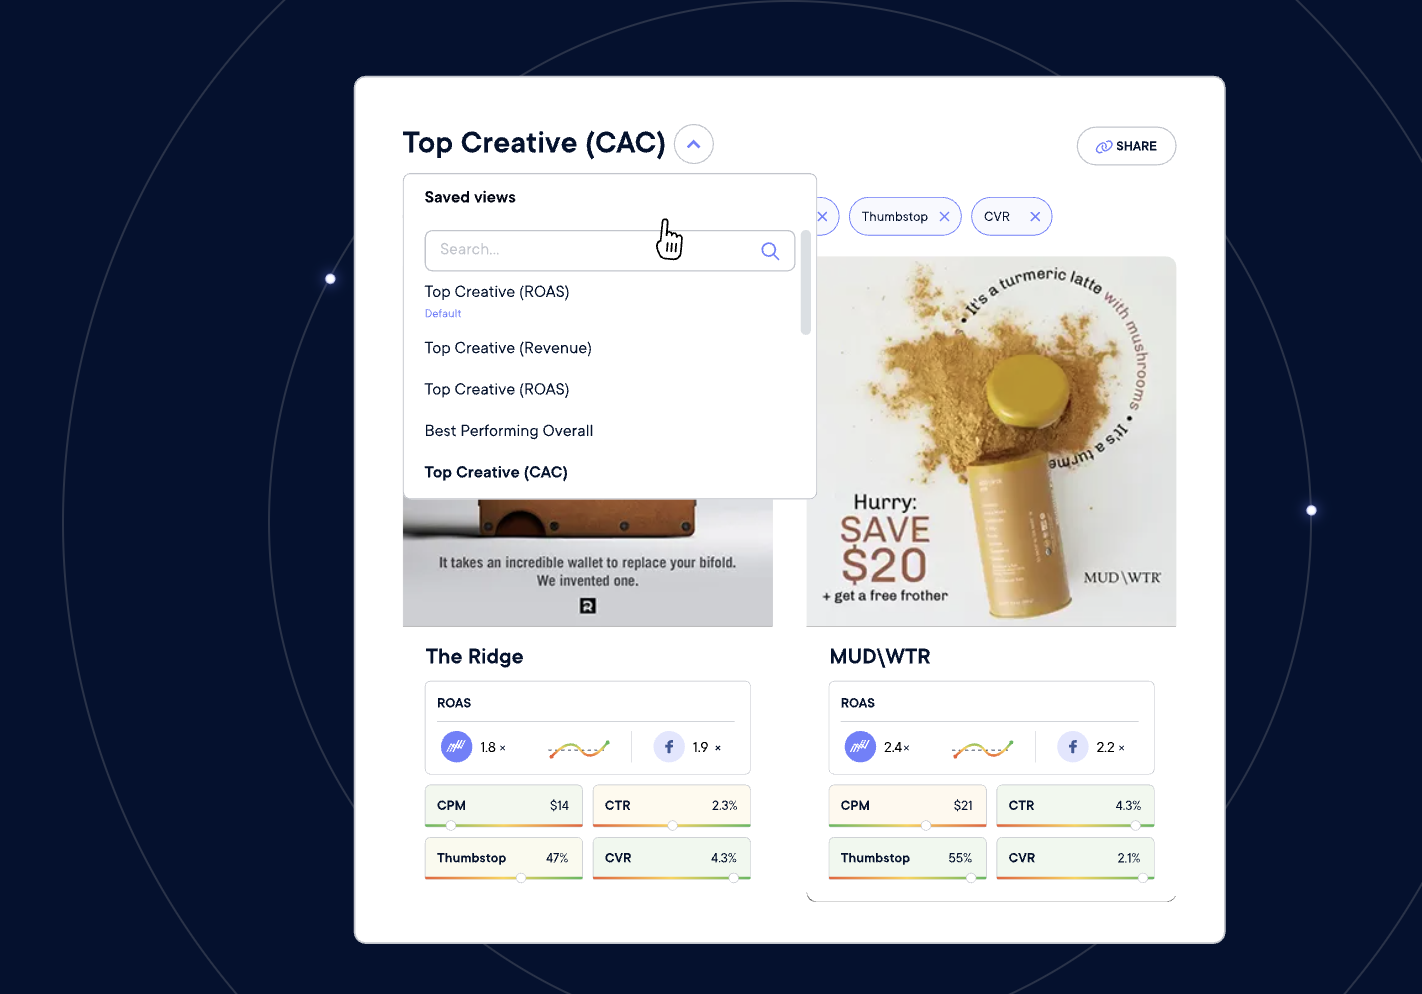
- Creative Analytics — This shows you which ads are working and which ones are burning out. You can filter by platform, campaign, or even ad format to identify the creatives worth scaling.
Standout Feature
Clicks + Views Enhanced is one feature that genuinely changed how I view awareness campaigns. Unlike most tools that only count last-click conversions, Northbeam lets you attribute sales to impressions, even if the user never clicked.
This matters a lot for platforms like TikTok, where engagement happens differently. It helped me see which ads were quietly driving conversions and shift budget accordingly.

Northbeam Pricing
- Starter Plan — Starts at $1,000/month. Includes MTA, 4x daily data refresh, Shopify integration, and onboarding. For up to 1M monthly pageviews.
- Professional Plan — Starts at $3,500/month. Adds Creative Analytics, export API, any eCommerce integration, and up to 6 annual strategy sessions.
- Enterprise Plan — Custom pricing. Includes multiple instances, Apex integration, dedicated success manager, and up to 12 annual media strategy sessions.

Northbeam Pros And Cons
✅ Accurate attribution with flexible lookback and impression tracking.
✅ Full access to first-party data across all major eCommerce platforms.
✅ Creative analysis and media mix modeling in one place.
❌ Steep monthly pricing, especially for early-stage brands.
❌ The interface may feel complex without onboarding.
6. Madgicx
Best For: Facebook marketers and ad agencies looking to automate reporting, track creative performance, and optimize campaigns in one place.
Similar To: AdEspresso, Revealbot, Triple Whale.
Madgicx is the platform I use when I want to save time managing Facebook and cross-channel ads without compromising on insights. It combines automated reporting, asset-level analytics, creative performance tracking, and optimization workflows; all inside a clean and customizable interface.
What makes Madgicx different is how tightly it focuses on performance marketing. From ROAS tracking to creative labeling powered by AI, it removes the clutter and helps you act faster.

Madgicx Features
- Automated Ad Reporting — Set up daily, weekly, or monthly reports once, and Madgicx will automatically send them to your clients or stakeholders at the time you choose.
- White-Label Reports — Customize the reports with your own branding—your logo, not Madgicx’s. This is perfect if you’re an agency.
- Custom Metric Selection — You can include only the metrics your clients or team care about—like ROAS, cost per lead, or CTR (click-through rate).

Standout Feature
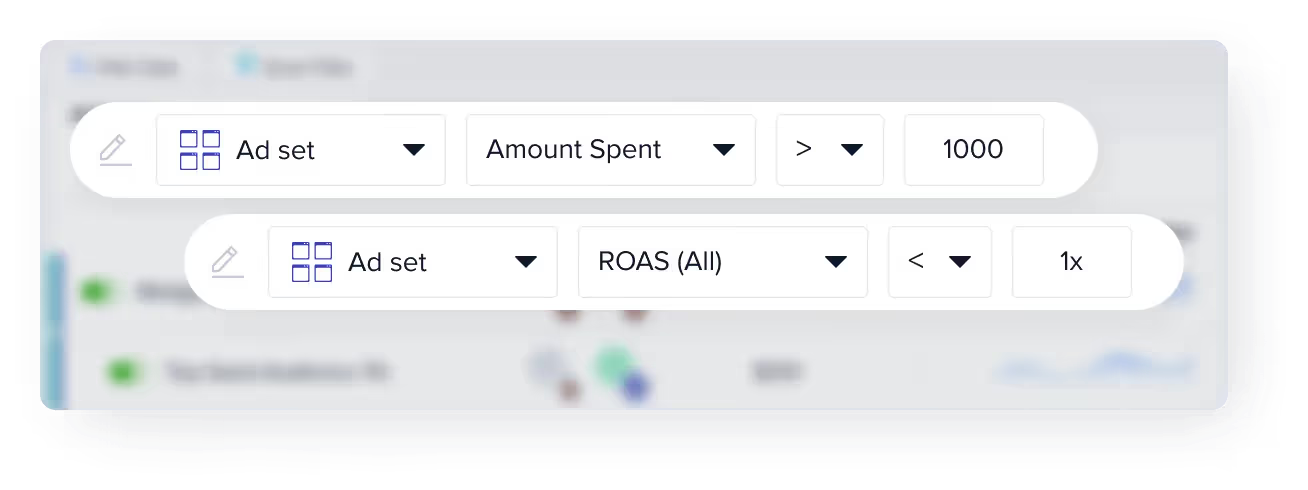
Ads Manager 2.0 is what I lean on most. Unlike Facebook’s native Ads Manager, this one lets me make bulk edits across campaigns, filter assets by custom rules, and actually visualize ROAS trends over time.
I can pause poor-performing ads, scale winners, and track the exact impact of changes—all without jumping between tabs. It saves hours each week and helps me act faster without second-guessing.
Madgicx Pricing
- All-in-One with AI Plan — $31/month. Includes campaign automation, ad creation, targeting, and analytics tools.
- Ad Library + AI Generator — $29/month. Gives you access to their full creative library and ad generation tools.
- One-Click Reporting Add-On — $29/month. Includes automated multi-channel reporting across Facebook, Google, and Shopify.

Madgicx Pros And Cons
✅ Easy-to-use automation and bulk editing tools save a lot of manual work.
✅ White-label reporting makes it agency-friendly.
✅ Creative tracking helps optimize design and content strategies.
❌ AI marketer features are still in beta and may not work consistently.
❌ Some users report technical issues when connecting ad accounts.
7. ThoughtMetric
Best for: E-commerce brands that want accurate marketing attribution and creative insights.
Similar to: Northbeam, Triple Whale, Rockerbox.
ThoughtMetric is one of the most accurate ad reporting tools I’ve used for e-commerce. It gives me a clear view of how every channel and creative impacts my sales. I don’t need to rely on inflated numbers from ad platforms. I can track the full customer journey, compare creative performance, and send conversion data back to platforms using server-side tagging.

ThoughtMetric Features
- Multi-Touch Attribution — You can track how each touchpoint, such as an ad click, email, or influencer mention, impacts your sale. It supports first-click, last-click, linear, position-based, time decay, and data-driven models.
- Cross-Channel Tracking — You can connect all your marketing platforms—Meta, TikTok, Google, Pinterest, Bing, email, SMS, affiliate, podcast, and even AI traffic—and track everything in one dashboard.
- Creative Performance Analysis — You can view side-by-side performance of your ads. This includes visual formats, copy, videos, and CTAs (calls to action). It helps you decide which creatives to pause, scale, or test again.
Standout Feature
ThoughtMetric’s biggest strength is its unbiased, independent attribution. It doesn’t rely on inflated or guessed data from Meta or Google. It tracks every user action using your own first-party data and server-side tagging.
I can switch attribution models anytime and validate performance using both behavioral data and post-purchase surveys. The accuracy helps me make ad decisions faster and with more confidence.

ThoughtMetric Pricing
ThoughtMetric charges based on monthly pageviews. All plans include the same features. Some plans include:
- Up to 50,000 pageviews — $99/month.
- Up to 100,000 pageviews — $199/month.
- Up to 300,000 pageviews — $399/month.

ThoughtMetric Pros and Cons
✅ Accurate attribution across multiple models.
✅ Easy-to-use dashboards with flexible filters.
✅ Server-side tracking and CAPI support.
❌ Heavily focused on e-commerce—limited lead gen support.
❌ May need time to learn how to read and act on all the attribution data.
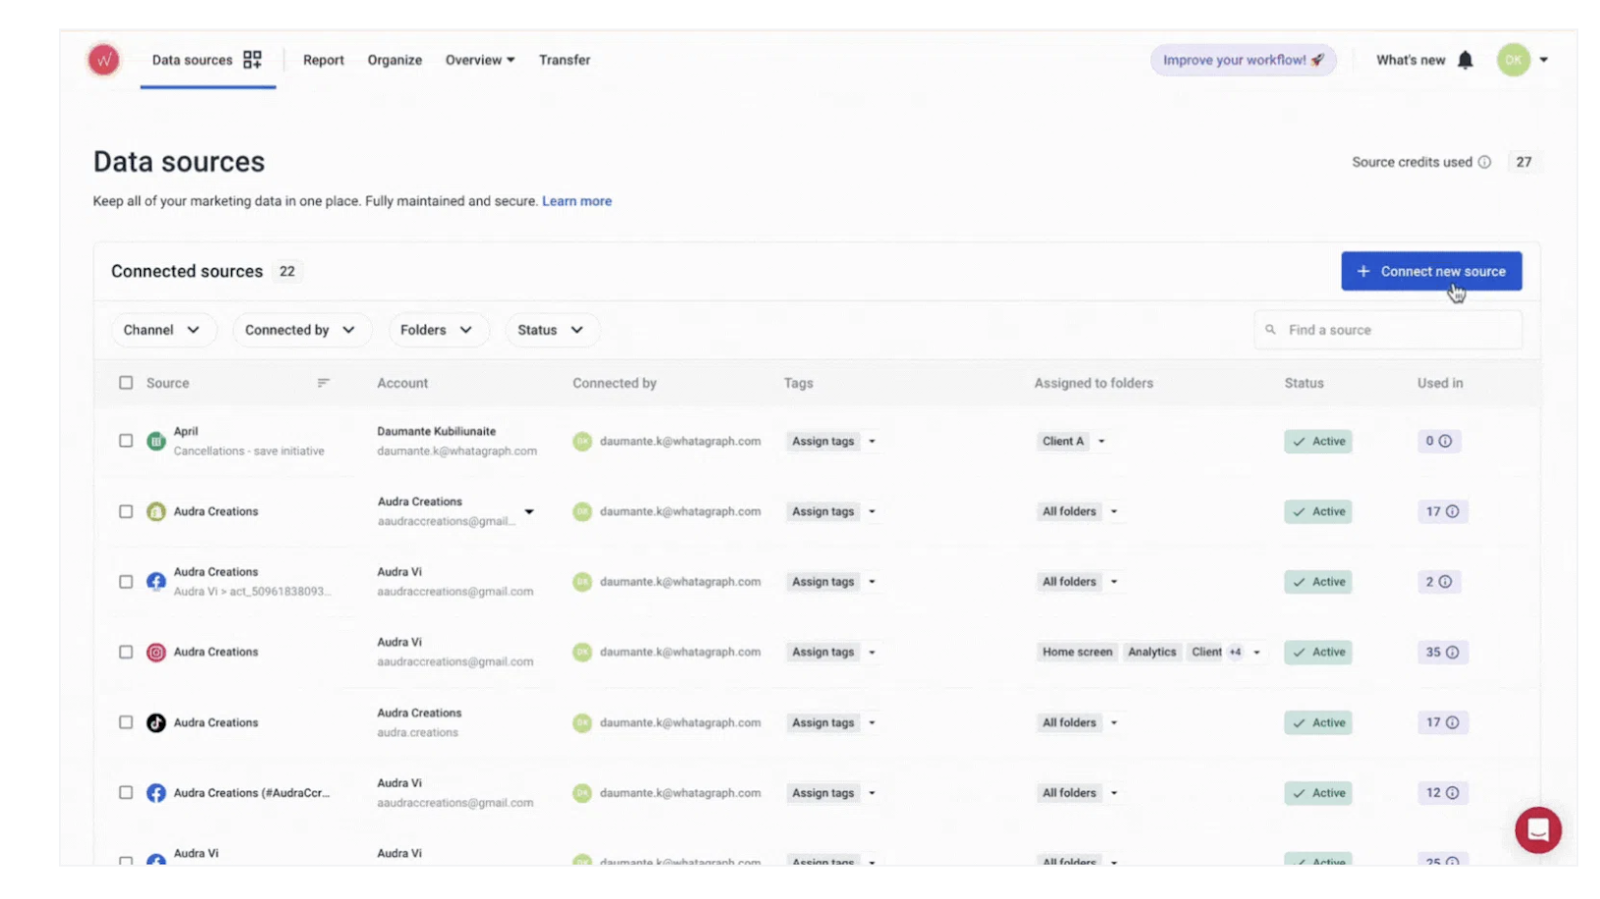
8. Whatagraph
Best For: Medium to large marketing agencies with 10+ employees.
Similar To: DashThis, Databox, AgencyAnalytics.
Whatagraph is a reporting platform designed for agencies that manage multiple clients and large volumes of data. I can build detailed reports, monitor performance across accounts, and use AI tools to turn data into insights without dealing with clunky spreadsheets or manual analysis.
It gives me full control over branding, metrics, and automation, so I can scale reporting without adding extra work.
Whatagraph Features
- Performance Monitoring — You can group scattered data into unified source groups, apply custom tags, and track team-wide or client-level performance in one view.
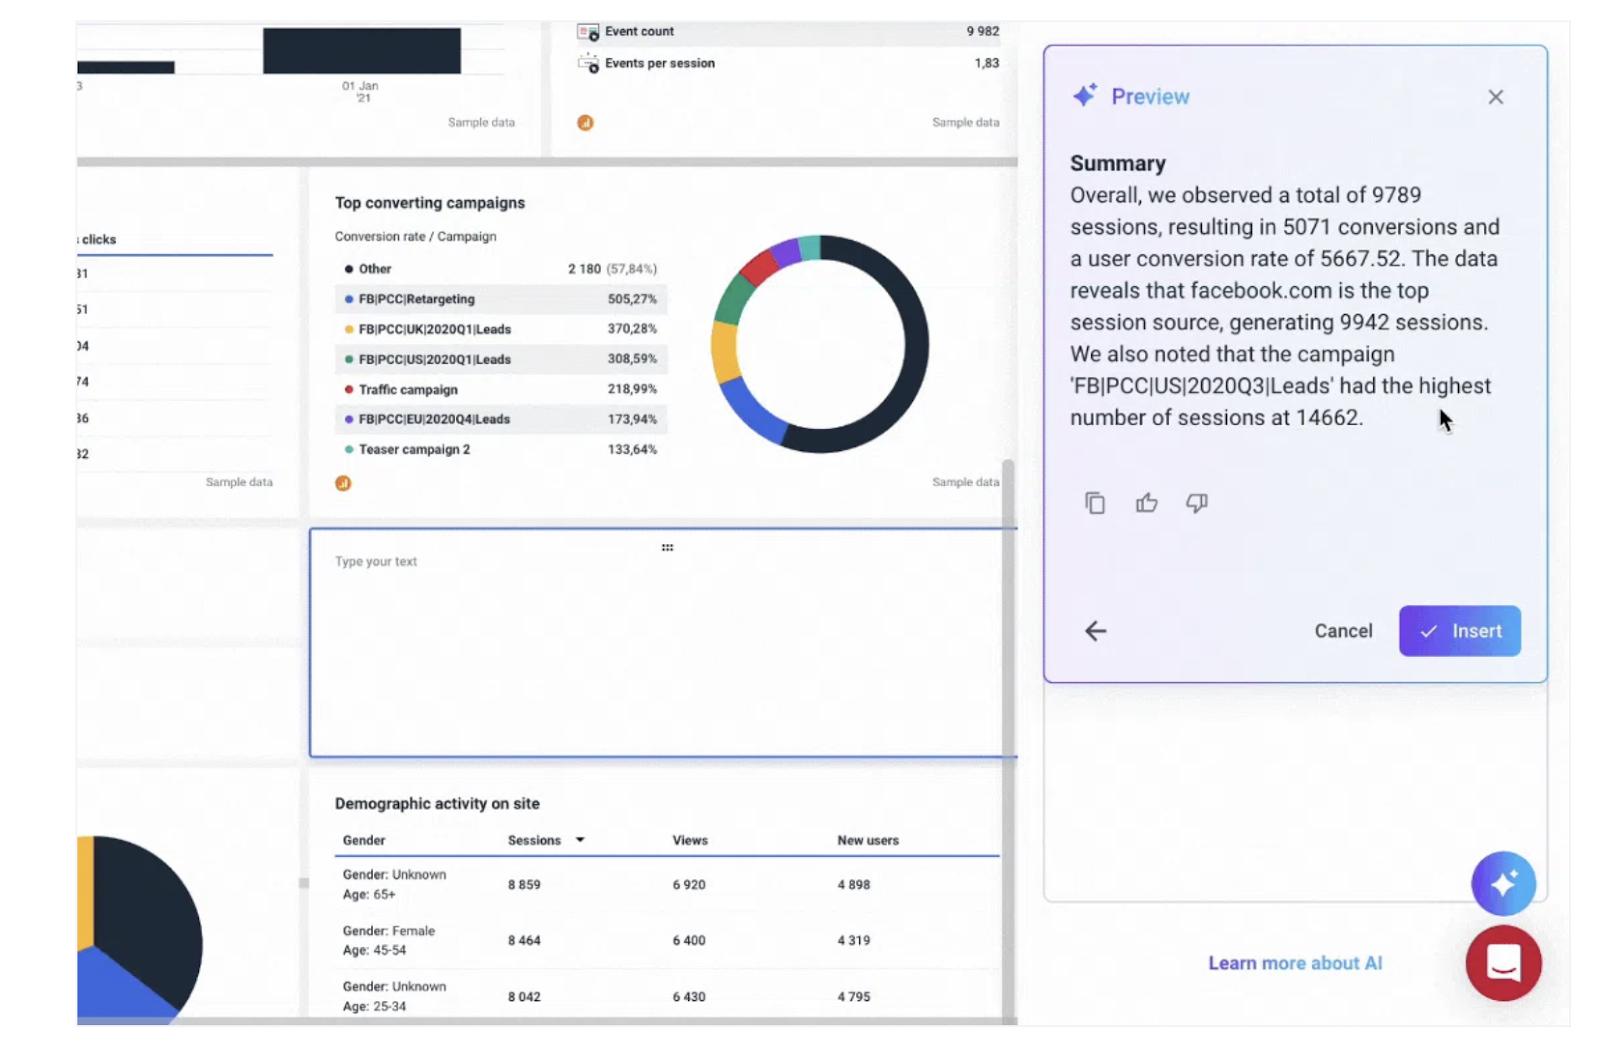
- AI Insights and Report Summaries — You can ask the AI chatbot questions about any connected data source and get instant summaries. It helps write performance updates in seconds, so your team doesn’t spend time crafting reports manually.
- Reliable Integrations — You get 55+ native integrations including Google Ads, Meta, TikTok, LinkedIn, Shopify, and more. All data connectors are built in-house, so syncing and updating data happens smoothly without delays or third-party bugs.
Standout Feature
Whatagraph’s standout feature is its ability to prepare clean, unified data automatically across multiple platforms. Once I connect my sources, the platform blends and standardizes metrics, which makes AI summaries and performance dashboards truly reliable.
This is where most tools fall short, but Whatagraph helps my team move faster with fewer errors and zero spreadsheets.
Whatagraph Pricing
- Whatagraph uses custom pricing based on source credits and feature access. Also, you can connect multiple data sources and blend them into one report.
Whatagraph Pros and Cons
✅ Clean, customizable reports for agencies with multiple clients.
✅ Strong AI chatbot and automated summaries.
✅ In-house data connectors reduce sync errors.
❌ May be expensive for small agencies or solo marketers.
❌ Heavily optimized for e-commerce and ad-based use cases.
9. SegMetrics
Best For: Advanced attribution tracking across long funnels and high-ticket products.
Similar To: Hyros, Triple Whale, Northbeam.
SegMetrics gives me full visibility into how my ad spend turns into revenue, even months after the first click. Unlike platforms that rely only on browser cookies, SegMetrics ties each sale back to a specific person using contact-based attribution.
This means I can finally trust my reporting data—whether I’m analyzing one-time purchases or lifetime value across long, complex funnels.
SegMetrics Features
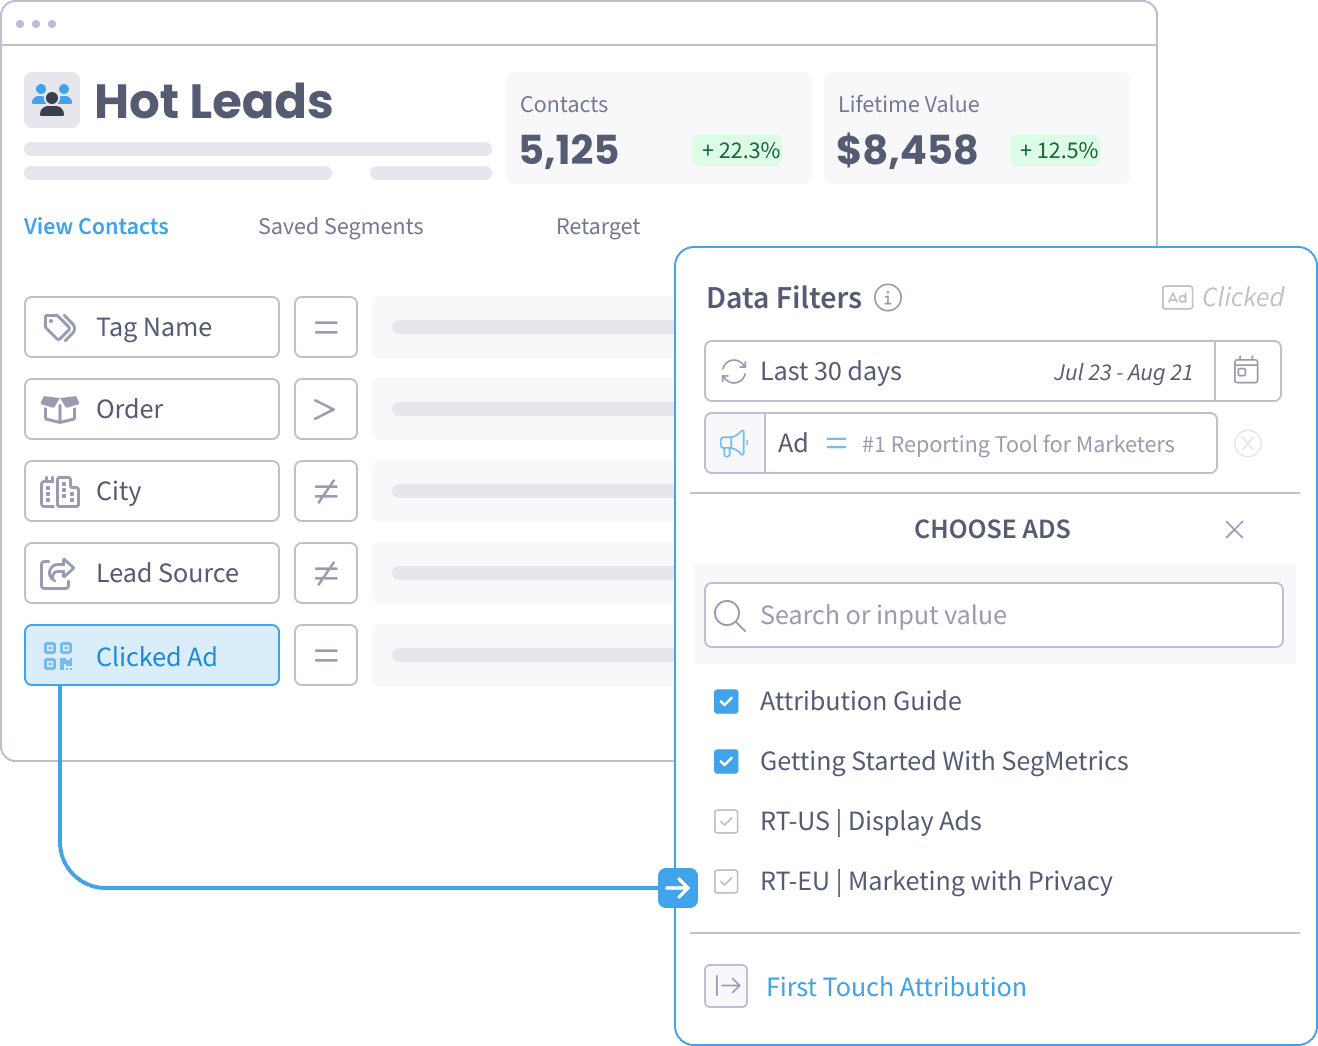
- Transparent Ad Reporting — You get full clarity on which ad, campaign, and platform drove each sale. Every dollar of spend and revenue is visible. You also get the names of leads and customers, not just anonymous events.
- Conversion Feeder — You can send real purchase data back to ad platforms like Facebook and Google. This helps their algorithms optimize for revenue instead of basic events like page views or signups.
- Team Dashboards & Segmentation — You can set up dashboards for team visibility and track key metrics by source, campaign, segment, or lead type. This makes it easy to focus on what’s working and spot issues fast.

Standout Feature
SegMetrics stands out for its AI-ready attribution system that connects ad spend directly to actual sales—without relying on guesswork or limited browser data. Instead of just tracking clicks or page visits, it ties every purchase back to a known contact across the entire funnel.
This means you can train your ad platforms’ AI with real sales data using the built-in Conversion Feeder, helping them optimize toward revenue, not just low-value actions.
SegMetrics Pricing
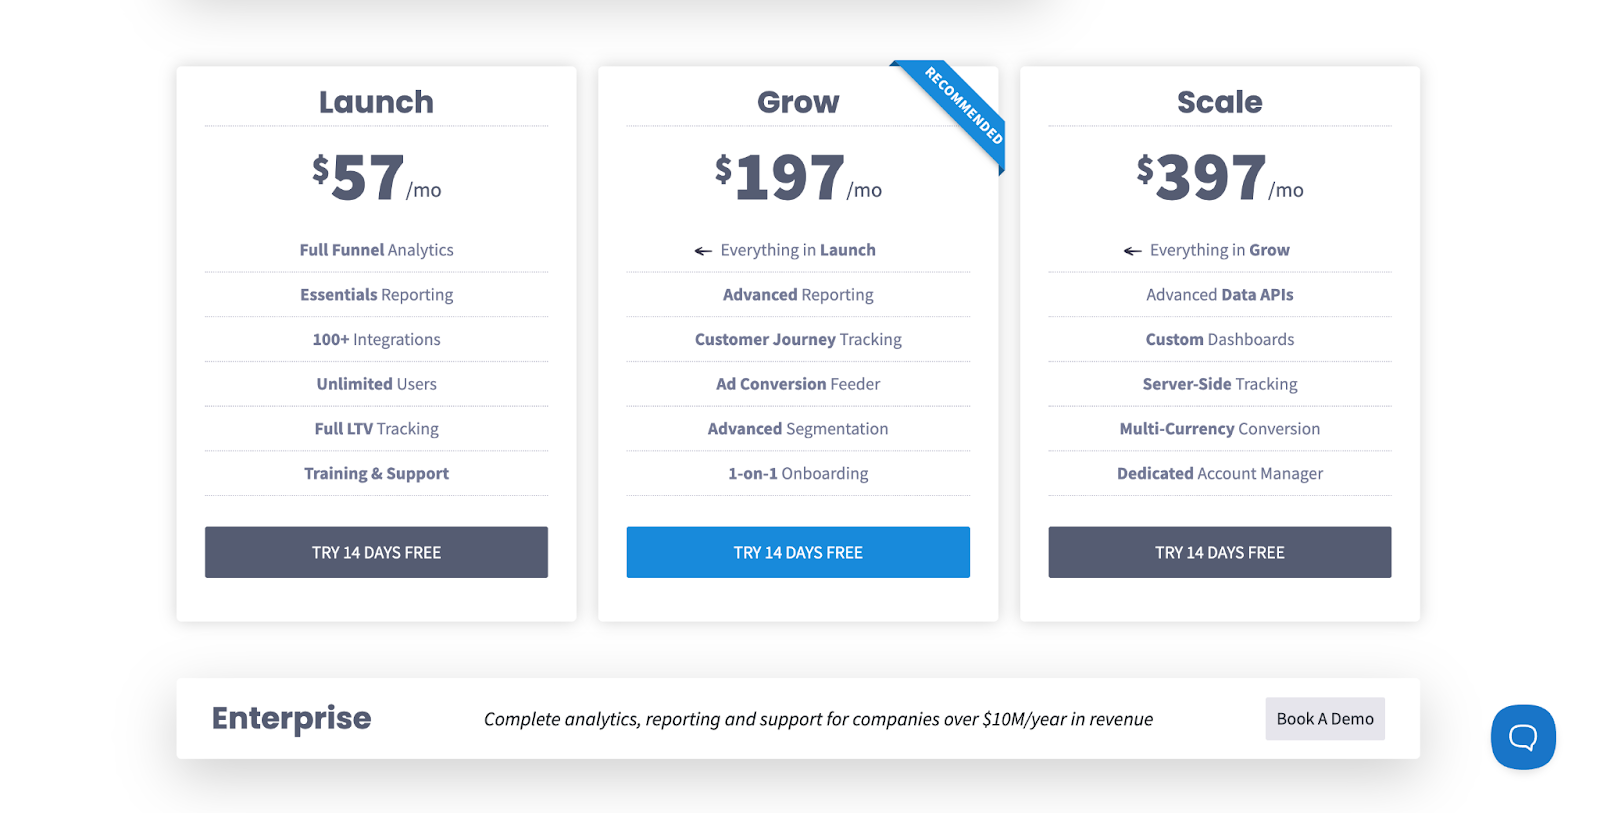
SegMetrics currently offers four different pricing plans for you to choose from:
- Launch Plan — $57/month. Includes full funnel analytics, essential reporting, 100+ integrations, unlimited users, full lifetime value tracking, and training and support.
- Grow Plan — $197/month. Includes everything in the Launch Plan plus advanced reporting, customer journey tracking, ad conversion feeder, advanced segmentation, and 1-on-1 onboarding.
- Scale Plan — $397/month. Includes everything in the Grow Plan plus advanced data APIs, custom dashboards, server-side tracking, multi-currency conversion, and a dedicated account manager.
- Enterprise Plan — Custom pricing. Includes full analytics, custom reporting, and dedicated support for companies making over $10M/year in revenue.
SegMetrics Pros and Cons
✅ Accurate LTV and RoAS reporting across long funnels.
✅ Great for high-ticket and subscription businesses.
✅ Easy setup with strong CRM integrations.
❌ Expensive for early-stage businesses or small teams.
❌ Some users report billing issues after cancellation.
10. Funnel
Best For: Mid-sized marketing teams running multiple campaigns across platforms.
Similar To: Supermetrics, Whatagraph, Adverity.
Funnel is one of the most reliable tools I’ve used to centralize and clean up ad data across channels. Instead of jumping between platforms and spreadsheets, I bring all my campaign performance data into one place.
The platform gives me a solid foundation to track spend, conversions, and performance trends, without building reports manually or relying on developers.

Funnel Features
- Smart Field Mapping and Normalization — Funnel lets me standardize campaign names, metrics, and dimensions across all platforms. This means I can report on “Cost per Click” from Facebook, Google, and LinkedIn in a single metric—without manually editing spreadsheets.
- Multi-Currency Support — I run ads across global markets. Funnel automatically converts currencies based on my preferred exchange rate and lets me compare campaign performance in a single currency.
- AI-Powered Measurement Models — Funnel combines attribution, marketing mix modeling, and incrementality testing. I can see not just what performed best—but why. This helps me adjust my media spend based on true impact, not just clicks or views.

Standout Feature
Funnel gives me ad reporting built on clean, unified data. Its AI-powered measurement helps me identify wasted spend and double down on real performance drivers. Instead of just counting leads or clicks, I get a full view of which ads, channels, and campaigns are contributing to actual sales, across both online and offline sources.

Funnel Pricing
Funnel currently offers four different pricing plans for you to choose from:
- Free Tier — $0/month. Lets you connect up to 4 sources and 1 destination with access to basic features.
- Starter Plan — Custom pricing. Includes access to top connectors and marketing data modeling.
- Business Plan — Custom pricing. Includes 500+ connectors, advanced exports, and Funnel Measurement.
- Enterprise Plan — Custom pricing. Built for large teams with advanced support, services, and scalability.

Funnel Pros And Cons
✅ Connects to over 500 marketing platforms with stable integrations.
✅ Smart field mapping saves hours in manual data cleaning.
✅ AI-powered measurement helps improve spend allocation.
❌ No built-in visualization—requires external tools for charts.
❌ Pricing is not listed publicly and may not suit small teams.
Next Steps: Choose the Right AI Ads Reporting Tool For Your Needs
Finding the right AI tool depends on how you manage campaigns and what kind of insights your team needs. For example, if you’re focused on lifetime value reporting, down-funnel attribution, and revenue-based campaign tracking, then SegMetrics or Funnel are strong options to consider.
But if you’re looking for a flexible, prompt-based AI tool that lets your entire team generate campaign reports, and store reusable workflows, then Team-GPT is your best bet. It gives you full control over how reports are written, supports multiple AI models like GPT-4o and Claude, and makes team reporting faster and more consistent.
You can build reports in minutes, track performance across campaigns, and maintain prompt templates across clients or departments; all from a single shared space.
Book a demo to try Team-GPT today and simplify how your team analyzes ad performance.
Read More
- 17 ChatGPT Prompts For Data Analysis To Save Time In 2025: Learn how to speed up your data analysis with practical ChatGPT prompts.
- 10 Best AI Prompt Builders In 2025 [Reviewed]: Explore how choosing the right prompt builder can improve how you interact with AI tools.
- 15 Examples & Use Cases of AI Agents In 2025: This article covers 15 real-world examples of how AI agents are making workflows faster and smarter.
- 15 Real-World Examples of AI Automation In 2025: This post breaks down real examples across marketing, HR, sales, and customer support.
- 32 AI Prompts For Business In 2025 That Work In Any Industry: We’ve compiled 32 prompts you can use for planning, analysis, content, and strategy—no matter your business type.